Adaptive ggplot2 Color Scales with Color Interpolation

My R package ggsci has included a few popular discrete color palettes. The colors values in these palettes are not automatically generated from a color space but hand-picked instead, often containing only five to ten distinct colors. A frequent question from the users is: What should I do when the colors are running out due to a more significant number of categories in the data?
Better approaches may exist, but an ad hoc method is to interpolate the color values to generate more colors based on the number of categories. Here, I will demonstrate how to construct such an “adaptive” color palette generator and the ggplot2 color scales for all ggsci color palettes.
CAUTION: It might be better not to encode too many categories in different colors. Please see the recommendations from the common pitfalls of color use chapter in the Fundamentals of Data Visualization book by Claus O. Wilke.
We start with the color interpolation logic as a
function factory
and leverage grDevices::colorRampPalette().
#' Adaptive palette (discrete)
#'
#' Create a discrete palette that will use the first `n` colors from
#' the supplied color values when the palette has enough colors.
#' Otherwise, use an interpolated color palette.
#'
#' @param values Color values.
pal_ramp <- function(values) {
  force(values)
  function(n) {
    if (n <= length(values)) {
      values[seq_len(n)]
    } else {
      colorRampPalette(values, alpha = TRUE)(n)
    }
  }
}
Then, we create a color palette generator function, similar to the existing color palette generator functions in ggsci. The main difference here is that you can access and interpolate the raw color values of any palettes in ggsci.
#' Adaptive color palette generator
#'
#' Adaptive color palette generator for ggsci color palettes using `pal_ramp()`.
#'
#' @param name Color palette name in ggsci
#' @param palette Color palette type in ggsci
#' @param alpha Transparency level, a real number in (0, 1].
#'
#' @details See `names(ggsci:::ggsci_db)` for all color palette names in ggsci.
#' See `names(ggsci:::ggsci_db$"pal")` for available palette types under
#' the palette `pal`.
pal_adaptive <- function(name, palette, alpha = 1) {
  if (alpha > 1L | alpha <= 0L) stop("alpha must be in (0, 1]")

  raw_cols <- ggsci:::ggsci_db[[name]][[palette]]
  raw_cols_rgb <- col2rgb(raw_cols)
  alpha_cols <- rgb(
    raw_cols_rgb[1L, ], raw_cols_rgb[2L, ], raw_cols_rgb[3L, ],
    alpha = alpha * 255L, names = names(raw_cols),
    maxColorValue = 255L
  )

  pal_ramp(unname(alpha_cols))
}
NOTE: For technical reasons, the raw color data for the iTerm color palettes and color scales (
pal_iterm(),scale_*_iterm()) introduced in ggsci 4.0.0 are stored in a separate objectggsci:::ggsci_db_itermrather thanggsci:::ggsci_db.You can access the two variants (“normal” and “bright”) of these palettes via, for example,
ggsci:::ggsci_db_iterm[["Palette Name"]][["normal"]]andggsci:::ggsci_db_iterm[["Palette Name"]][["bright"]].
Finishing up by creating the ggplot2 color scales as usual.
#' Adaptive color scales
#'
#' @inheritParams pal_adaptive
#' @param ... additional parameters for [ggplot2::discrete_scale()].
scale_color_adaptive <- function(name, palette, alpha = 1, ...) {
  ggplot2::discrete_scale("colour", palette = pal_adaptive(name, palette, alpha), ...)
}

scale_fill_adaptive <- function(name, palette, alpha = 1, ...) {
  ggplot2::discrete_scale("fill", palette = pal_adaptive(name, palette, alpha), ...)
}
Feels easy enough? Let’s test it in the wild with some high-cardinality data.
We trained some tissue-specific gene embeddings on GTEx data using GloVe. The embeddings are then projected to a 2D plane with t-SNE.
word_vectors <- readRDS(url(
  "https://raw.githubusercontent.com/nanxstats/exp2vec/main/output/Pancreas_embedding.rds"
))
tsne_out <- readRDS(url(
  "https://raw.githubusercontent.com/nanxstats/exp2vec/main/output/Pancreas_tsne.rds"
))
Run k-means clustering on the projected coordinates and get 15 clusters:
set.seed(42)
cl <- kmeans(word_vectors, centers = 15, iter.max = 20)
df <- cbind(as.data.frame(tsne_out$Y), as.factor(cl$cluster))
names(df) <- c("x", "y", "cluster")
The original color palette only has 8 colors, but it will work fine here:
ggplot2::ggplot(df, ggplot2::aes(x = x, y = y)) +
  ggplot2::geom_point(ggplot2::aes(colour = cluster), alpha = 0.5, size = 1) +
  cowplot::theme_minimal_grid() +
  scale_color_adaptive(name = "nejm", palette = "default")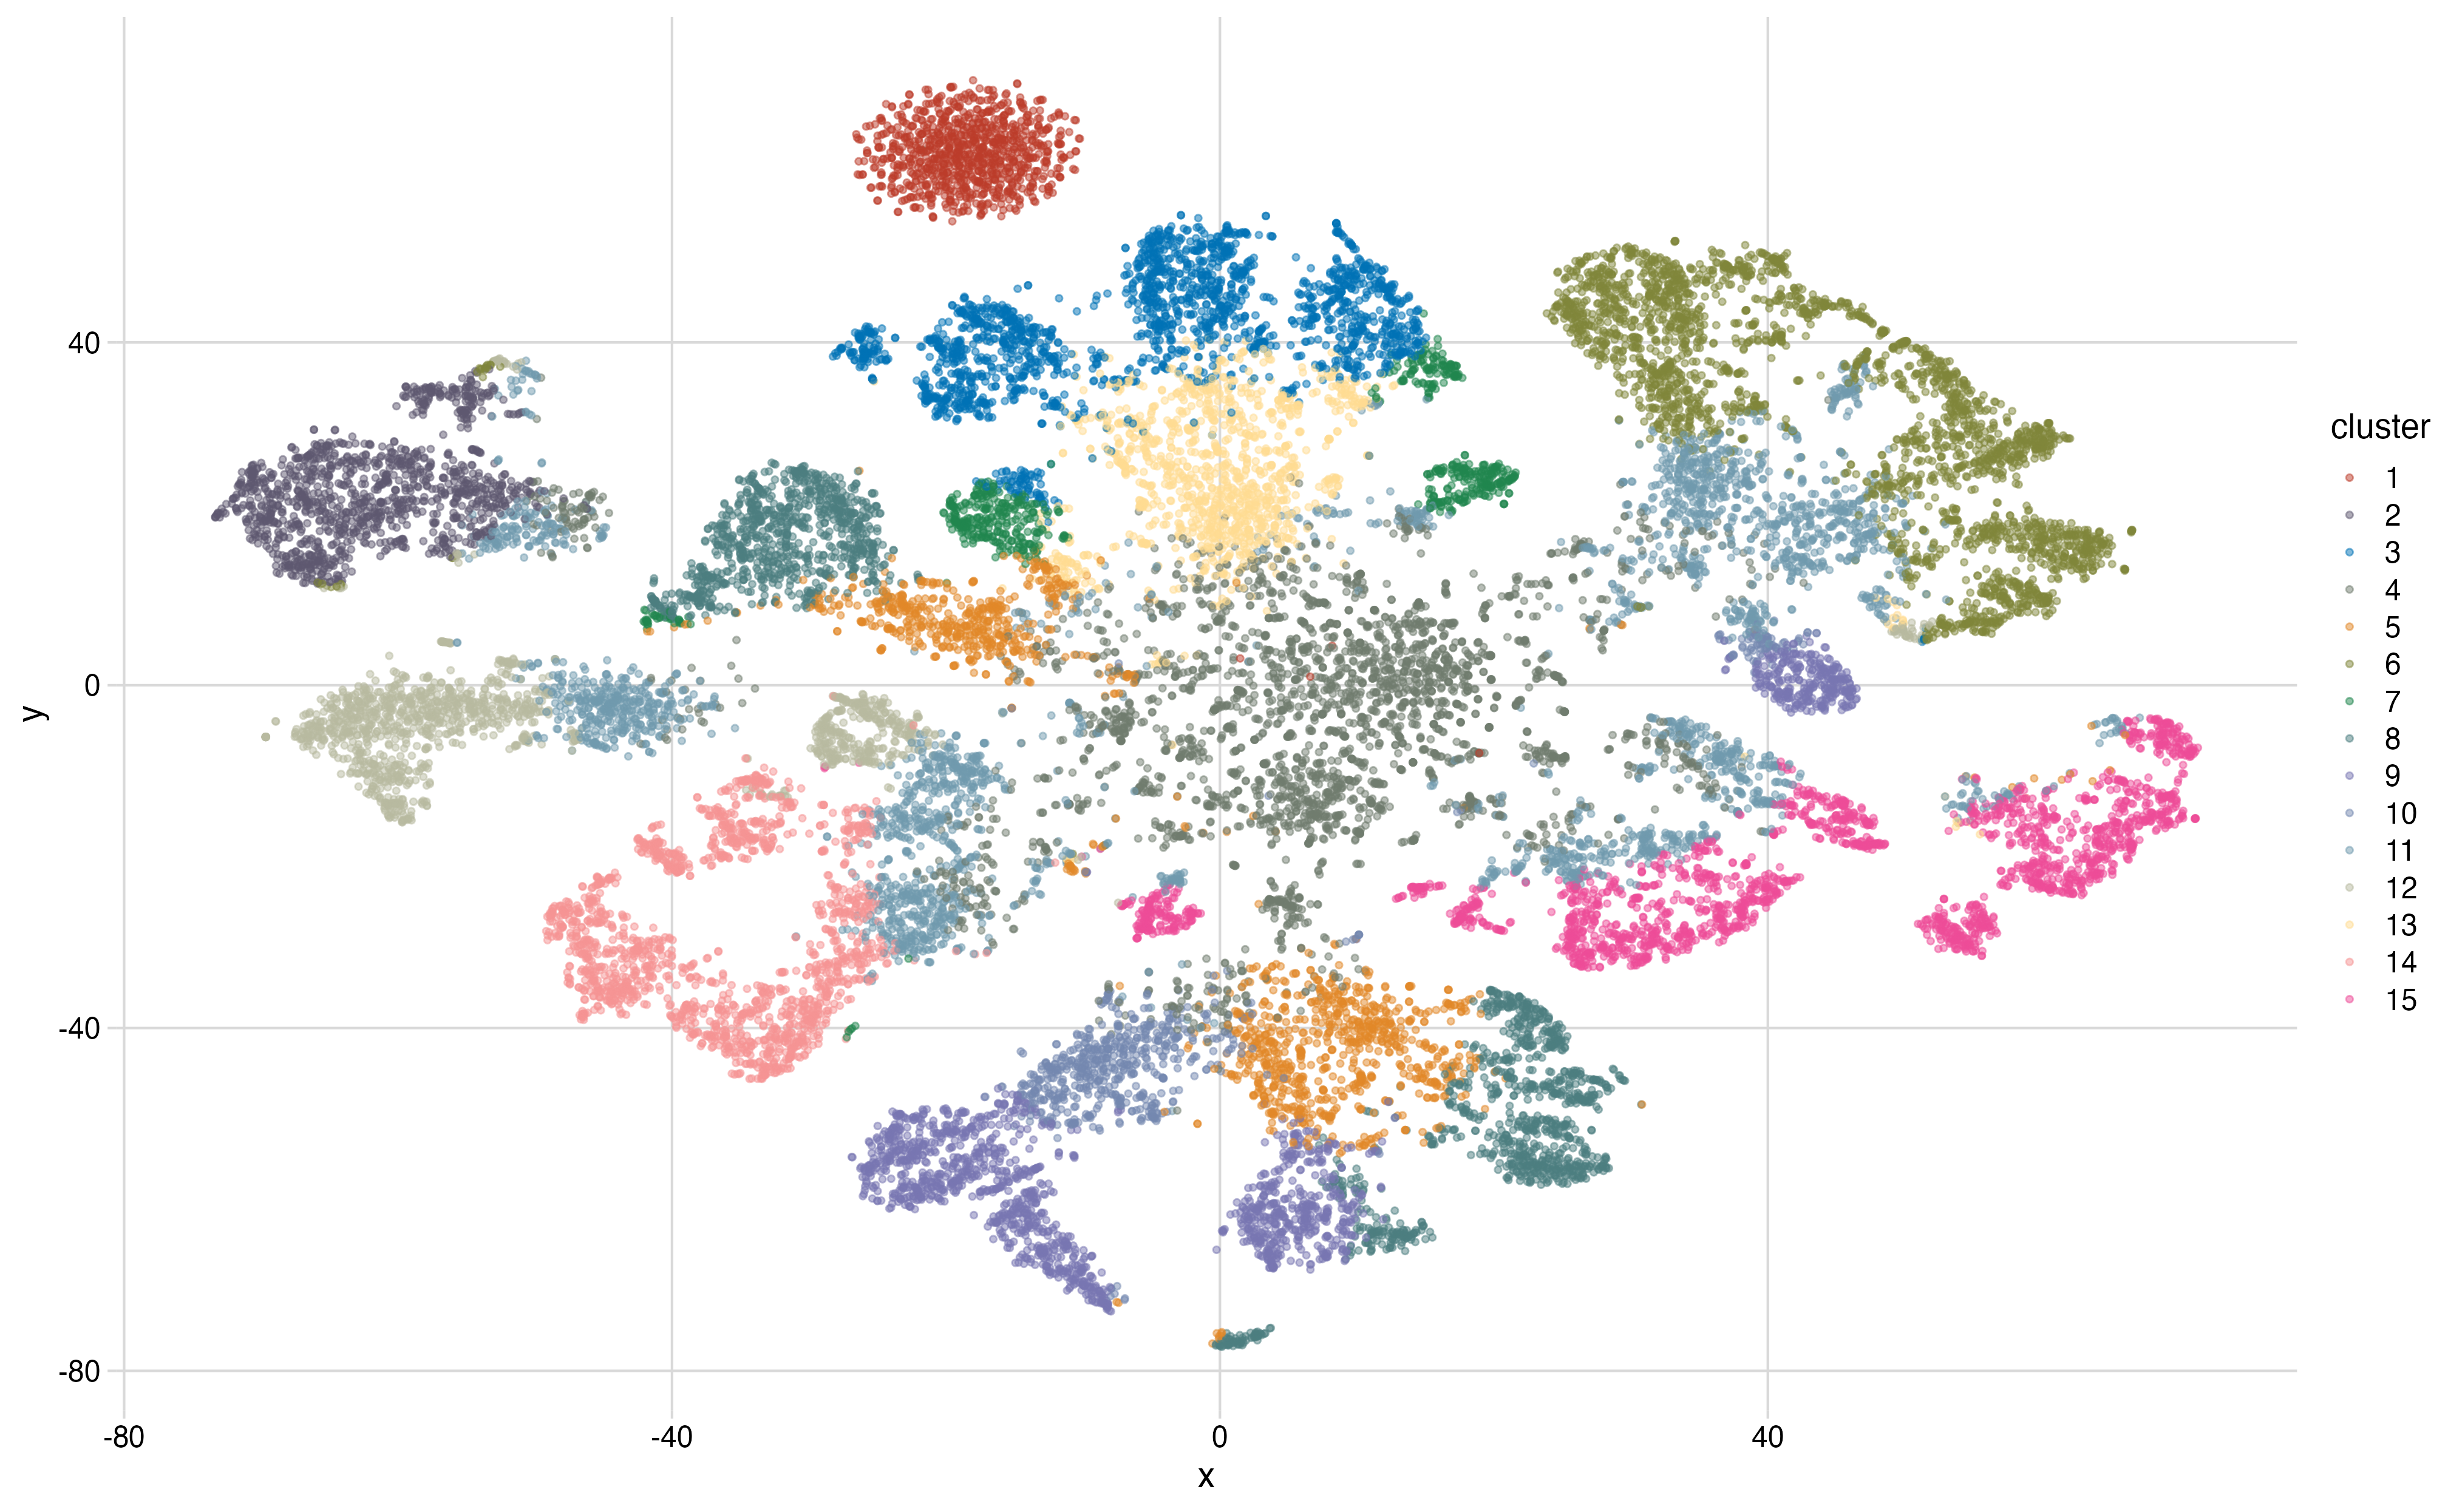
That’s all, folks.