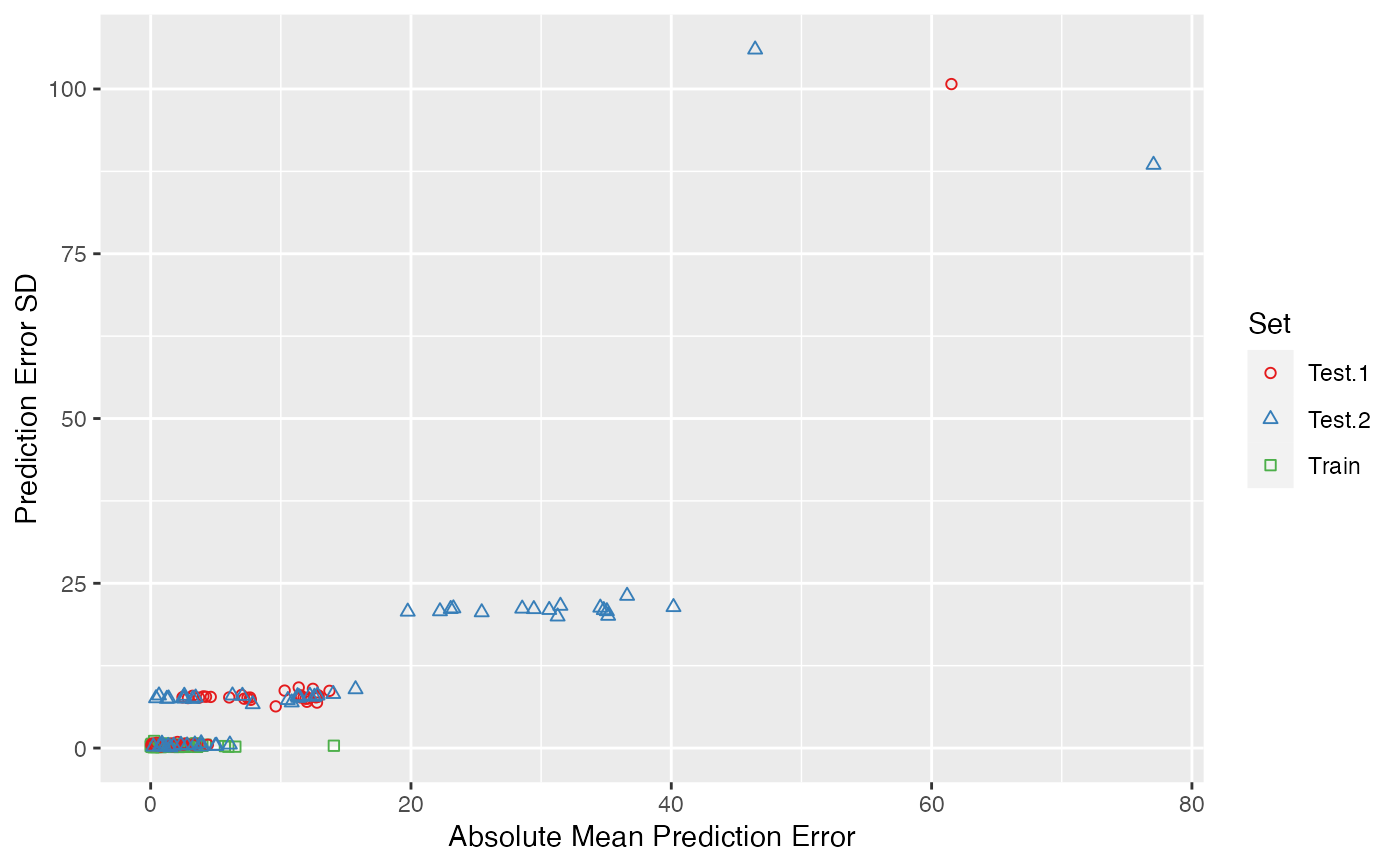
Plot enpls.ad object
See also
See enpls.ad for model applicability domain
evaluation with ensemble partial least squares regressions.
Author
Nan Xiao <https://nanx.me>
Examples
data("alkanes")
x <- alkanes$x
y <- alkanes$y

# training set
x.tr <- x[1:100, ]
y.tr <- y[1:100]

# two test sets
x.te <- list(
  "test.1" = x[101:150, ],
  "test.2" = x[151:207, ]
)
y.te <- list(
  "test.1" = y[101:150],
  "test.2" = y[151:207]
)

set.seed(42)
ad <- enpls.ad(
  x.tr, y.tr, x.te, y.te,
  space = "variable", method = "mc",
  ratio = 0.9, reptimes = 50
)
plot(ad)

# the interactive plot requires a HTML viewer
if (FALSE) { # \dontrun{
plot(ad, type = "interactive")
} # }
# the interactive plot requires a HTML viewer
if (FALSE) { # \dontrun{
plot(ad, type = "interactive")
} # }