Power calculation for a joint analysis of a two-stage case control design for SNP data
Source:R/cats.R
cats.RdPower calculation for a joint analysis of a two-stage case control design for SNP data.
Usage
cats(
  freq = 0.5,
  freq2 = -1,
  ncases = 500,
  ncontrols = 500,
  ncases2 = 500,
  ncontrols2 = 500,
  risk = 1.5,
  risk2 = -1,
  pisamples = -1,
  prevalence = 0.1,
  prevalence2 = -1,
  additive = 0,
  recessive = 0,
  dominant = 0,
  multiplicative = 1,
  alpha = 1e-07,
  pimarkers = 0.00316
)
Arguments
- freq
numeric. The minor allele frequency (MAF) in the first stage
- freq2
numeric. The MAF in the second stage, Optional, if -1 the same value as for the first stage is given
- ncases
integer. The number of cases in the first stage
- ncontrols
integer. The number of controls in the first stage
- ncases2
integer. The number of cases in the second stage
- ncontrols2
integer. The number of controls in the second stage
- risk
numeric. The relative risk in the first stage
- risk2
numeric. The relative risk in the second stage, Optional, if -1 the same value as for the first stage is given
- pisamples
numeric. The weights used for the joint statistic. Optional. see details
- prevalence
numeric. The prevalence of the disease in the population for the first stage
- prevalence2
numeric. The prevalence of the disease in the population for the second stag, Optional, if -1 the same value as for the first stage is given
- additive
boolean. if 1 an additive model is assumed
- recessive
boolean. if 1 a recessive model is assumed
- dominant
boolean. if 1 a dominant model is assumed
- multiplicative
boolean. if 1 a multiplicative model is assumed
- alpha
numeric. The significance threshold. Often the a threshold of 0.05 divided by the number of markers is chosen
- pimarkers
numeric. The fraction of markers genotyped in the second stage
Value
- P.one.study
The power if only one study was performed, NB! This is only a valid estimate if the relative risk and allele frequency is the same for both stages
- P.first.stage
The power for a marker to proceed the the second stage
- P.rep.study
The power of the study if based on replication and not a joint analysis
- P.joint.min
The power of the joint analysis tp detect at least one susceptibility SNP assuming that five susceptibility SNPs exits
- P.joint
The power of the joint analysis
- pi
The weight used to calculate the joint statistic
- T.one.study
Recommended thresholds for a one-stage study
- T.first.stage
Recommended thresholds for the first stage in two-stage study
- T.second.stage.rep
Recommended thresholds for the second stage in replication analysis
- T.second.stage.joint
Recommended thresholds for the second stage in a joint analysis
- E.Disease.freq.cases1
The expected disease allele frequency in stage 1 for cases
- E.Disease.freq.controls1
The expected disease allele frequency in stage 1 for controls
- E.Disease.freq.cases2
The expected disease allele frequency in stage 2 for cases
- E.Disease.freq.controls2
The expected disease allele frequency in stage 2 for controls
Details
These power analysis are based on Skol et al. 2006, But are generized so that the ratio between cases and controls may vary between stages. Also the allele frequencies, disease prevalence and relative risk are also allowed to vary. The joint statistic $z_joint=z_1\sqrt\pi+z_2\sqrt1-\pi$ where $z_1$ is the z-score for the first stage and the weight $\pi$ is calculated as $\pi=1/var(\hatp'_1-\hatp_1)*(1/var(\hatp'_1-\hatp_1)+1/var(\hatp'_2-\hatp_2))^-1$, where $\hatp'_1$ is the estimate of the allele frequency of the cases in the first stage. This is consistent with Skol et al 2006 when the ratios of cases and controls are the same in both stages. When this is not the case the weight $\pi$ may vary slightly with different allele frequencies and different relative risks. For power calculations I would recommend calculating the weight at a likely scenario where there is about 80-90% power and fixing the weights at other scenarios (and the testing of the real data) to this weight. This can be done by assigning pisample to a value. In practice this will hardly affect the power.
References
Skol AD, Scott LJ, Abecasis GR, Boehnke M: Joint analysis is more efficient than replication-based analysis for two-stage genome-wide association studies. Nat Genet 38: 209-213, 2006.
Examples
# calculate the power under a multiplicative model using a two stage design
# and assuming a relative risk of 1.5
cats(
freq = 0.2,
ncases = 500, ncases2 = 500,
ncontrols = 1000, ncontrols2 = 1000,
risk = 1.5, multiplicative = 1
)
#> Expected Power is;
#>
#>
#>
#> For a one-stage study = 0.94
#> For first stage in two-stage study = 0.972
#> For second stage in replication analysis = 0.784
#> For second stage in a joint analysis = 0.929
#> pi = 0.5
#>
power.J <- c()
power.R <- c()
power.O <- c()
RR <- 23:32 / 20
for (tal in 1:length(RR)) {
temp <- cats(risk = RR[tal])
power.J[tal] <- temp$P.joint
power.R[tal] <- temp$P.rep.study
power.O[tal] <- temp$P.one.study
}
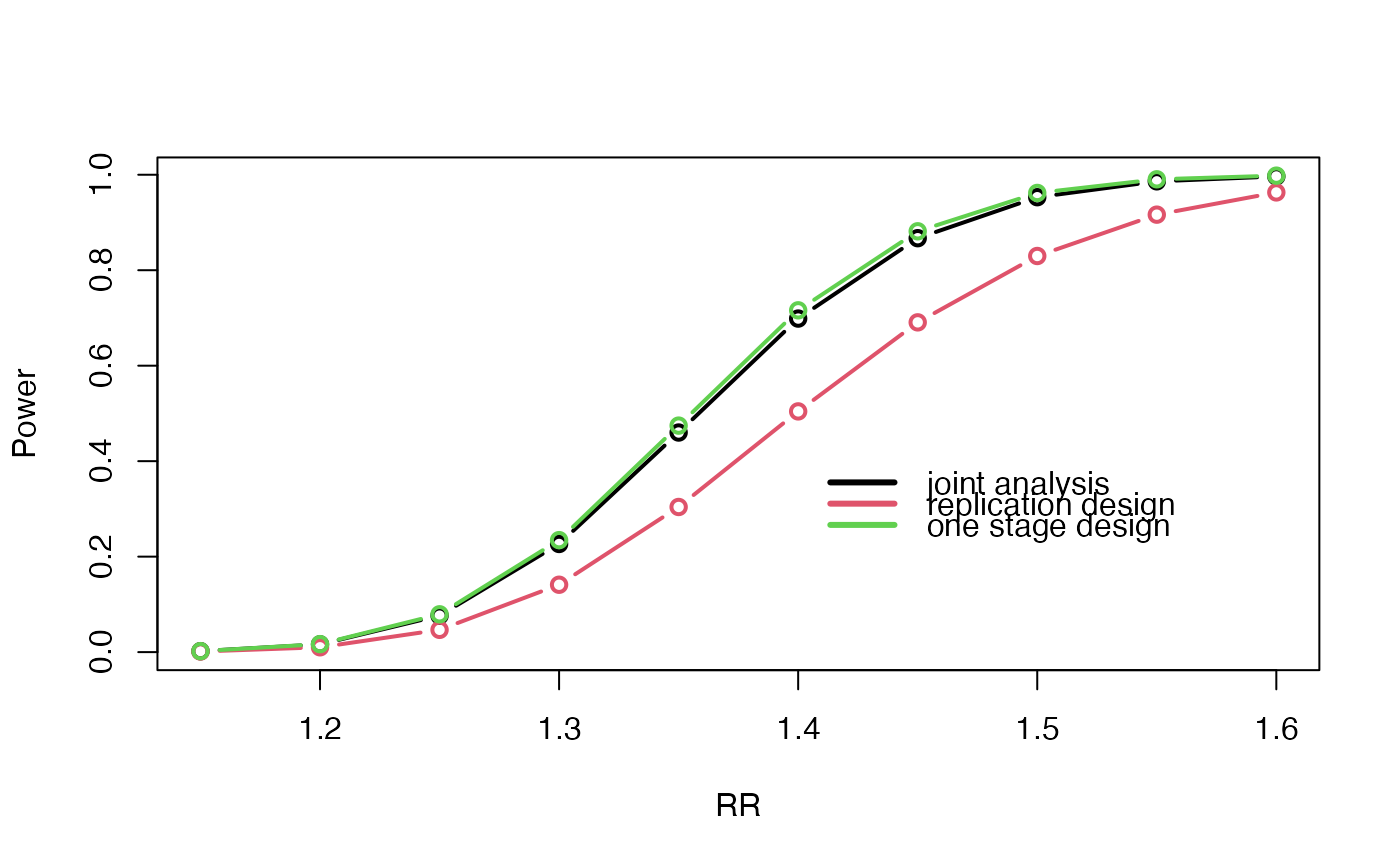
plot(RR, power.J, type = "b", lwd = 2, ylab = "Power")
lines(RR, power.R, lwd = 2, col = 2, type = "b")
lines(RR, power.O, lwd = 2, col = 3, type = "b")
legend(1.4, 0.4, c(
"joint analysis", "replication design",
"one stage design"
), col = 1:3, lwd = 3, bty = "n")