Compare high-dimensional Cox models by model validation
Source:R/5_1_compare_by_validate.R
compare_by_validate.RdCompare high-dimensional Cox models by model validation
Usage
compare_by_validate(
  x,
  time,
  event,
  model.type = c("lasso", "alasso", "flasso", "enet", "aenet", "mcp", "mnet", "scad",
    "snet"),
  method = c("bootstrap", "cv", "repeated.cv"),
  boot.times = NULL,
  nfolds = NULL,
  rep.times = NULL,
  tauc.type = c("CD", "SZ", "UNO"),
  tauc.time,
  rule = c("lambda.min", "lambda.1se"),
  cox.ties = c("breslow", "efron"),
  seed = 1001,
  trace = TRUE
)
Arguments
- x
Matrix of training data used for fitting the model; on which to run the validation.
- time
Survival time. Must be of the same length with the number of rows as
x.- event
Status indicator, normally 0 = alive, 1 = dead. Must be of the same length with the number of rows as
x.- model.type
Model types to compare. Could be at least two of
"lasso","alasso","flasso","enet","aenet","mcp","mnet","scad", or"snet".- method
Validation method. Could be
"bootstrap","cv", or"repeated.cv".- boot.times
Number of repetitions for bootstrap.
- nfolds
Number of folds for cross-validation and repeated cross-validation.
- rep.times
Number of repeated times for repeated cross-validation.
- tauc.type
Type of time-dependent AUC. Including
"CD"proposed by Chambless and Diao (2006).,"SZ"proposed by Song and Zhou (2008).,"UNO"proposed by Uno et al. (2007).- tauc.time
Numeric vector. Time points at which to evaluate the time-dependent AUC.
- rule
Model selection criterion for glmnet models, `"lambda.min"` or `"lambda.1se"`. Defaults to `"lambda.min"`.
- cox.ties
Cox tie-handling method for glmnet model fits and refits.
- seed
A random seed for cross-validation fold division.
- trace
Logical. Output the validation progress or not. Default is
TRUE.
References
Chambless, L. E. and G. Diao (2006). Estimation of time-dependent area under the ROC curve for long-term risk prediction. Statistics in Medicine 25, 3474–3486.
Song, X. and X.-H. Zhou (2008). A semiparametric approach for the covariate specific ROC curve with survival outcome. Statistica Sinica 18, 947–965.
Uno, H., T. Cai, L. Tian, and L. J. Wei (2007). Evaluating prediction rules for t-year survivors with censored regression models. Journal of the American Statistical Association 102, 527–537.
Examples
data(smart)
x <- as.matrix(smart[, -c(1, 2)])[1:1000, ]
time <- smart$TEVENT[1:1000]
event <- smart$EVENT[1:1000]
# Compare lasso and adaptive lasso by 5-fold cross-validation
cmp.val.cv <- compare_by_validate(
x, time, event,
model.type = c("lasso", "alasso"),
method = "cv", nfolds = 5, tauc.type = "UNO",
tauc.time = seq(0.25, 2, 0.25) * 365, seed = 1001
)
#> Starting model 1 : lasso
#> Start fold 1
#> Start fold 2
#> Start fold 3
#> Start fold 4
#> Start fold 5
#> Starting model 2 : alasso
#> Start fold 1
#> Start fold 2
#> Start fold 3
#> Start fold 4
#> Start fold 5
print(cmp.val.cv)
#> High-Dimensional Cox Model Validation Object
#> Random seed: 1001
#> Validation method: k-fold cross-validation
#> Cross-validation folds: 5
#> Model type: lasso
#> glmnet model alpha: 1
#> glmnet model lambda: 0.01685167
#> glmnet model penalty factor: not specified
#> Time-dependent AUC type: UNO
#> Evaluation time points for tAUC: 91.25 182.5 273.75 365 456.25 547.5 638.75 730
#>
#> High-Dimensional Cox Model Validation Object
#> Random seed: 1001
#> Validation method: k-fold cross-validation
#> Cross-validation folds: 5
#> Model type: alasso
#> glmnet model alpha: 1
#> glmnet model lambda: 0.07078988
#> glmnet model penalty factor: specified
#> Time-dependent AUC type: UNO
#> Evaluation time points for tAUC: 91.25 182.5 273.75 365 456.25 547.5 638.75 730
#>
summary(cmp.val.cv)
#> Model type: lasso
#> 91.25 182.5 273.75 365 456.25 547.5 638.75
#> Mean 0.5511243 0.5925684 0.6157828 0.6724317 0.6529270 0.6829645 0.6662401
#> Min 0.2045455 0.3668810 0.4950835 0.5237988 0.5015233 0.5435762 0.5447591
#> 0.25 Qt. 0.3926117 0.5301080 0.5093405 0.5326304 0.5326304 0.5803628 0.6024634
#> Median 0.6598985 0.5328432 0.5331871 0.6364637 0.6311011 0.6738583 0.6484020
#> 0.75 Qt. 0.7146465 0.6639884 0.6669128 0.8014350 0.7298959 0.7476453 0.6851695
#> Max 0.7839196 0.8690212 0.8743898 0.8678306 0.8694842 0.8693798 0.8504064
#> 730
#> Mean 0.6490519
#> Min 0.5688426
#> 0.25 Qt. 0.6025604
#> Median 0.6518439
#> 0.75 Qt. 0.6635122
#> Max 0.7585003
#>
#> Model type: alasso
#> 91.25 182.5 273.75 365 456.25 547.5 638.75
#> Mean 0.5684793 0.5951063 0.6204221 0.6768852 0.6582206 0.6910868 0.6709637
#> Min 0.2095960 0.3401222 0.4781737 0.5159743 0.4938931 0.5691100 0.5744797
#> 0.25 Qt. 0.4089347 0.4905127 0.4904133 0.5522508 0.5522508 0.5738813 0.5875864
#> Median 0.6294416 0.5427310 0.5395271 0.6083475 0.6039312 0.6523808 0.6273858
#> 0.75 Qt. 0.7904040 0.7094755 0.6987968 0.8207581 0.7521768 0.7718022 0.6994370
#> Max 0.8040201 0.8926900 0.8951997 0.8870953 0.8888509 0.8882597 0.8659296
#> 730
#> Mean 0.6499762
#> Min 0.5751707
#> 0.25 Qt. 0.5870420
#> Median 0.6323552
#> 0.75 Qt. 0.6767323
#> Max 0.7785809
#>
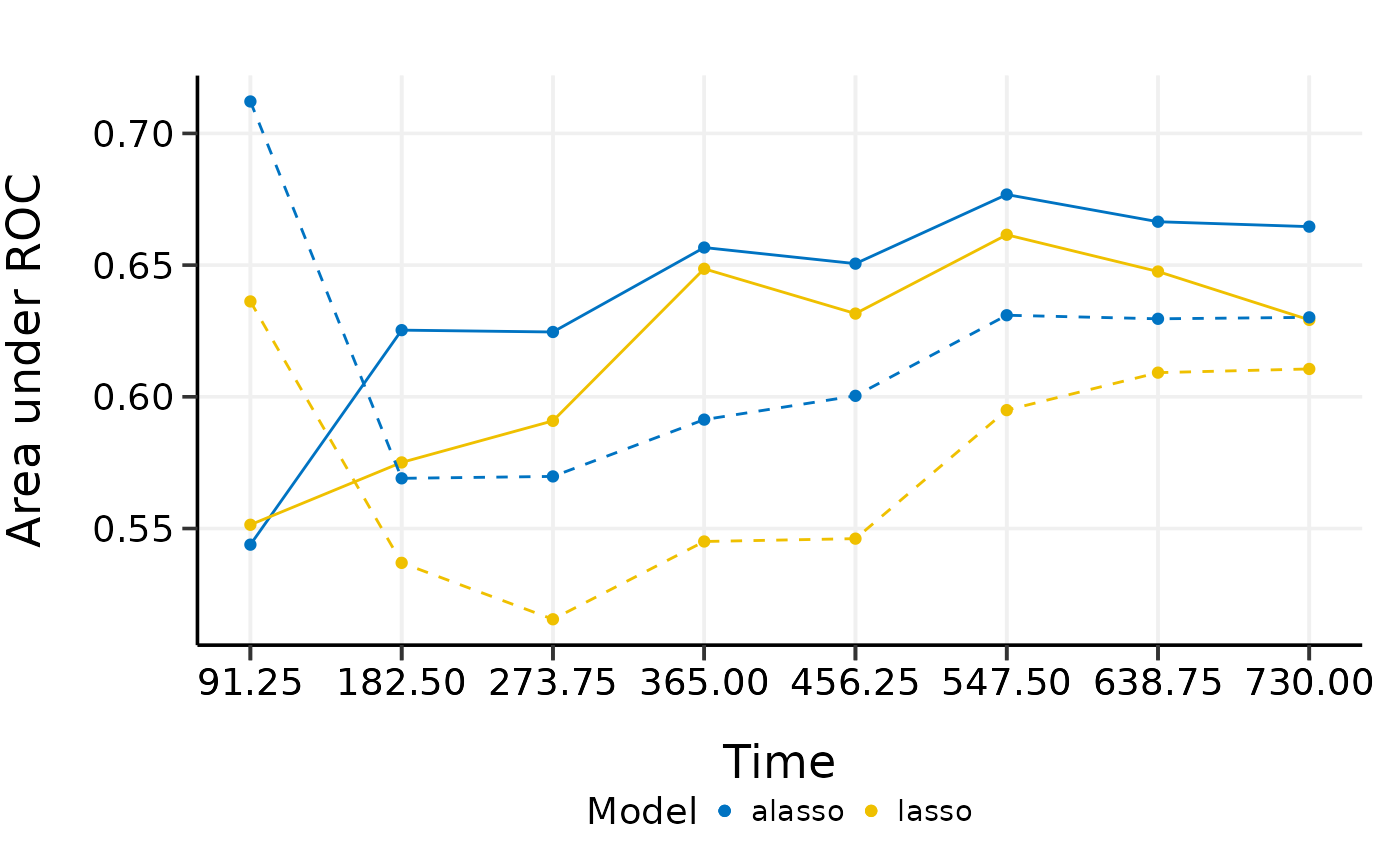
plot(cmp.val.cv)
#> 91.25 182.5 273.75 365 456.25 547.5 638.75
#> Mean 0.5511243 0.5925684 0.6157828 0.6724317 0.6529270 0.6829645 0.6662401
#> Min 0.2045455 0.3668810 0.4950835 0.5237988 0.5015233 0.5435762 0.5447591
#> 0.25 Qt. 0.3926117 0.5301080 0.5093405 0.5326304 0.5326304 0.5803628 0.6024634
#> Median 0.6598985 0.5328432 0.5331871 0.6364637 0.6311011 0.6738583 0.6484020
#> 0.75 Qt. 0.7146465 0.6639884 0.6669128 0.8014350 0.7298959 0.7476453 0.6851695
#> Max 0.7839196 0.8690212 0.8743898 0.8678306 0.8694842 0.8693798 0.8504064
#> 730
#> Mean 0.6490519
#> Min 0.5688426
#> 0.25 Qt. 0.6025604
#> Median 0.6518439
#> 0.75 Qt. 0.6635122
#> Max 0.7585003
#> 91.25 182.5 273.75 365 456.25 547.5 638.75
#> Mean 0.5684793 0.5951063 0.6204221 0.6768852 0.6582206 0.6910868 0.6709637
#> Min 0.2095960 0.3401222 0.4781737 0.5159743 0.4938931 0.5691100 0.5744797
#> 0.25 Qt. 0.4089347 0.4905127 0.4904133 0.5522508 0.5522508 0.5738813 0.5875864
#> Median 0.6294416 0.5427310 0.5395271 0.6083475 0.6039312 0.6523808 0.6273858
#> 0.75 Qt. 0.7904040 0.7094755 0.6987968 0.8207581 0.7521768 0.7718022 0.6994370
#> Max 0.8040201 0.8926900 0.8951997 0.8870953 0.8888509 0.8882597 0.8659296
#> 730
#> Mean 0.6499762
#> Min 0.5751707
#> 0.25 Qt. 0.5870420
#> Median 0.6323552
#> 0.75 Qt. 0.6767323
#> Max 0.7785809
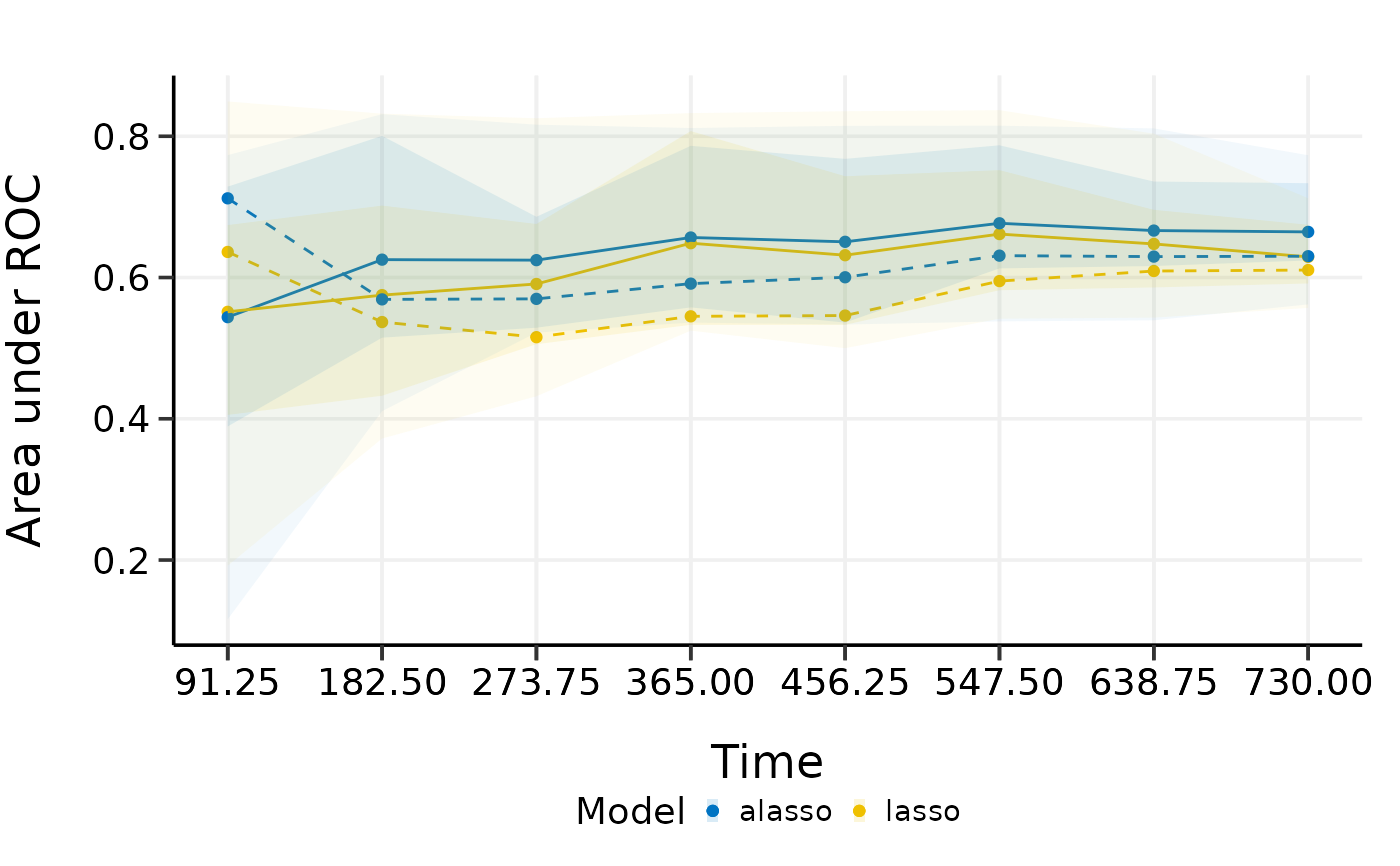
 plot(cmp.val.cv, interval = TRUE)
#> 91.25 182.5 273.75 365 456.25 547.5 638.75
#> Mean 0.5511243 0.5925684 0.6157828 0.6724317 0.6529270 0.6829645 0.6662401
#> Min 0.2045455 0.3668810 0.4950835 0.5237988 0.5015233 0.5435762 0.5447591
#> 0.25 Qt. 0.3926117 0.5301080 0.5093405 0.5326304 0.5326304 0.5803628 0.6024634
#> Median 0.6598985 0.5328432 0.5331871 0.6364637 0.6311011 0.6738583 0.6484020
#> 0.75 Qt. 0.7146465 0.6639884 0.6669128 0.8014350 0.7298959 0.7476453 0.6851695
#> Max 0.7839196 0.8690212 0.8743898 0.8678306 0.8694842 0.8693798 0.8504064
#> 730
#> Mean 0.6490519
#> Min 0.5688426
#> 0.25 Qt. 0.6025604
#> Median 0.6518439
#> 0.75 Qt. 0.6635122
#> Max 0.7585003
#> 91.25 182.5 273.75 365 456.25 547.5 638.75
#> Mean 0.5684793 0.5951063 0.6204221 0.6768852 0.6582206 0.6910868 0.6709637
#> Min 0.2095960 0.3401222 0.4781737 0.5159743 0.4938931 0.5691100 0.5744797
#> 0.25 Qt. 0.4089347 0.4905127 0.4904133 0.5522508 0.5522508 0.5738813 0.5875864
#> Median 0.6294416 0.5427310 0.5395271 0.6083475 0.6039312 0.6523808 0.6273858
#> 0.75 Qt. 0.7904040 0.7094755 0.6987968 0.8207581 0.7521768 0.7718022 0.6994370
#> Max 0.8040201 0.8926900 0.8951997 0.8870953 0.8888509 0.8882597 0.8659296
#> 730
#> Mean 0.6499762
#> Min 0.5751707
#> 0.25 Qt. 0.5870420
#> Median 0.6323552
#> 0.75 Qt. 0.6767323
#> Max 0.7785809
plot(cmp.val.cv, interval = TRUE)
#> 91.25 182.5 273.75 365 456.25 547.5 638.75
#> Mean 0.5511243 0.5925684 0.6157828 0.6724317 0.6529270 0.6829645 0.6662401
#> Min 0.2045455 0.3668810 0.4950835 0.5237988 0.5015233 0.5435762 0.5447591
#> 0.25 Qt. 0.3926117 0.5301080 0.5093405 0.5326304 0.5326304 0.5803628 0.6024634
#> Median 0.6598985 0.5328432 0.5331871 0.6364637 0.6311011 0.6738583 0.6484020
#> 0.75 Qt. 0.7146465 0.6639884 0.6669128 0.8014350 0.7298959 0.7476453 0.6851695
#> Max 0.7839196 0.8690212 0.8743898 0.8678306 0.8694842 0.8693798 0.8504064
#> 730
#> Mean 0.6490519
#> Min 0.5688426
#> 0.25 Qt. 0.6025604
#> Median 0.6518439
#> 0.75 Qt. 0.6635122
#> Max 0.7585003
#> 91.25 182.5 273.75 365 456.25 547.5 638.75
#> Mean 0.5684793 0.5951063 0.6204221 0.6768852 0.6582206 0.6910868 0.6709637
#> Min 0.2095960 0.3401222 0.4781737 0.5159743 0.4938931 0.5691100 0.5744797
#> 0.25 Qt. 0.4089347 0.4905127 0.4904133 0.5522508 0.5522508 0.5738813 0.5875864
#> Median 0.6294416 0.5427310 0.5395271 0.6083475 0.6039312 0.6523808 0.6273858
#> 0.75 Qt. 0.7904040 0.7094755 0.6987968 0.8207581 0.7521768 0.7718022 0.6994370
#> Max 0.8040201 0.8926900 0.8951997 0.8870953 0.8888509 0.8882597 0.8659296
#> 730
#> Mean 0.6499762
#> Min 0.5751707
#> 0.25 Qt. 0.5870420
#> Median 0.6323552
#> 0.75 Qt. 0.6767323
#> Max 0.7785809