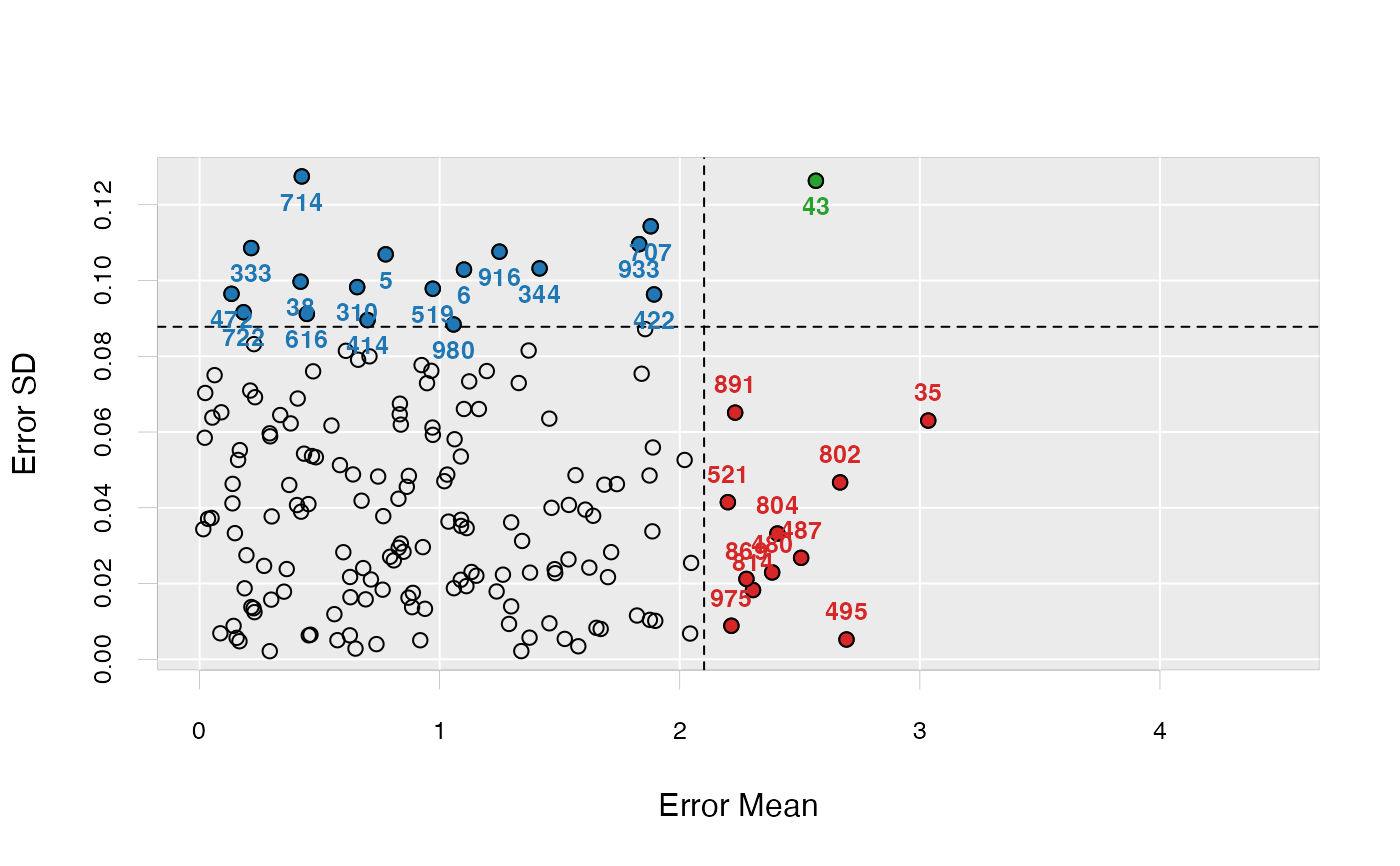
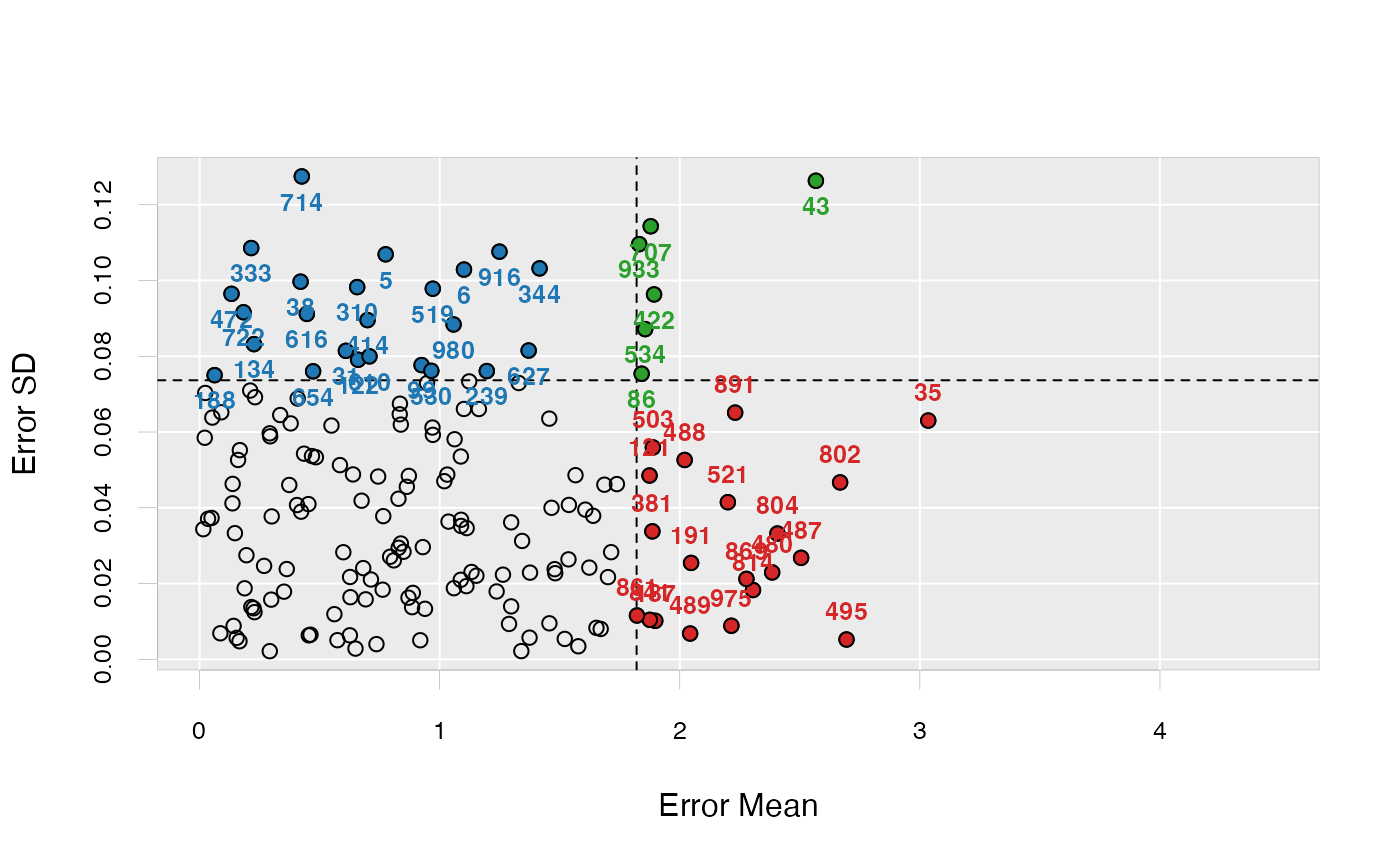
Plot enspls.od object
Arguments
- x
An object of class
enspls.od.- criterion
Criterion of being classified as an outlier, can be
"quantile"or"sd".- prob
Quantile probability as the cut-off value.
- sdtimes
Times of standard deviation as the cut-off value.
- alpha
An alpha transparency value for points, a real number in (0, 1].
- main
Plot title.
- ...
Additional graphical parameters for
plot.
See also
See enspls.od for outlier detection with
ensemble sparse partial least squares regressions.
Author
Nan Xiao <https://nanx.me>