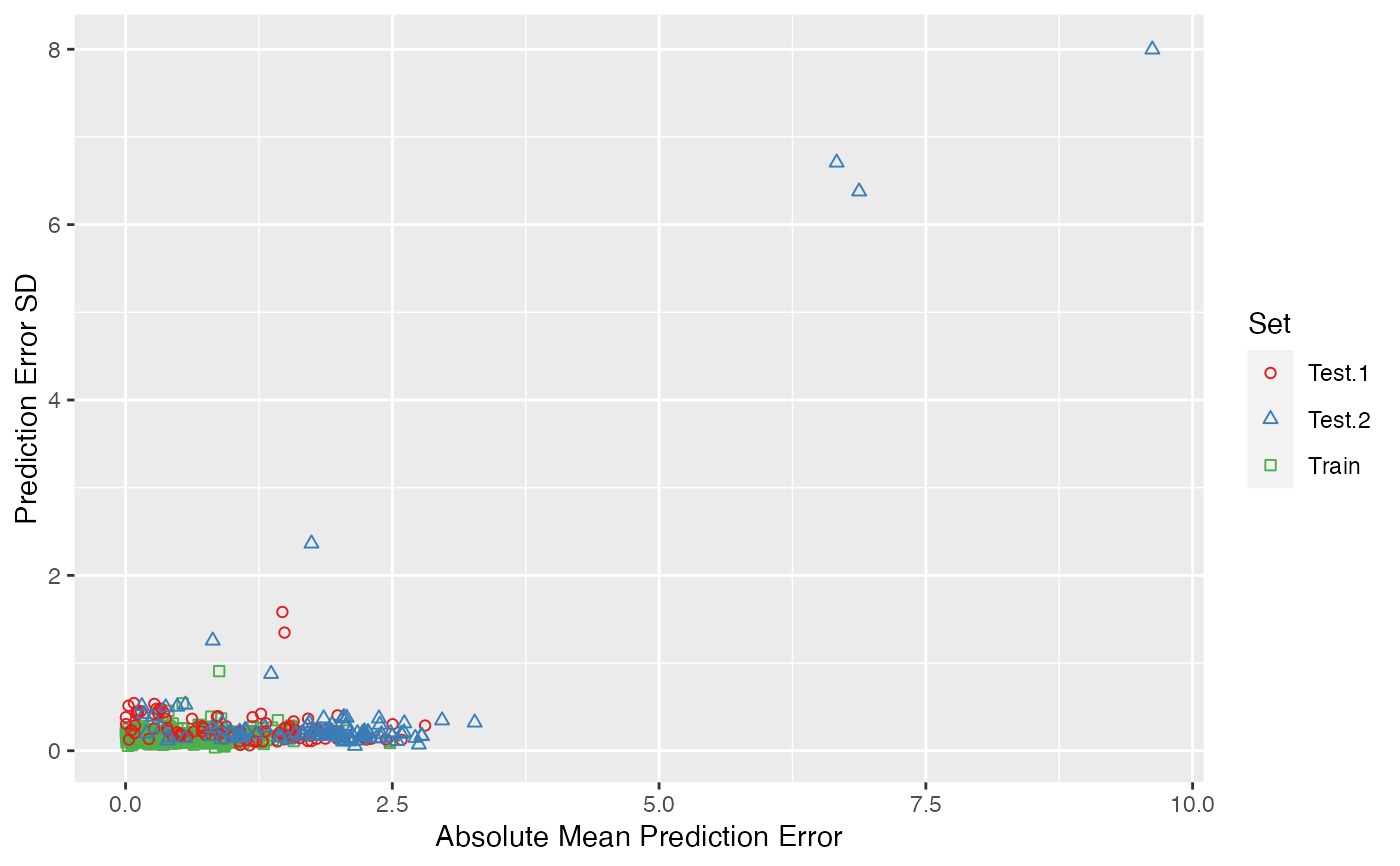
Plot enspls.ad object
Arguments
- x
An object of class
enspls.ad.- type
Plot type. Can be
"static"or"interactive".- main
Plot title.
- ...
Additional graphical parameters for
plot.
See also
See enspls.ad for model applicability domain
evaluation with ensemble sparse partial least squares regressions.
Author
Nan Xiao <https://nanx.me>
Examples
data("logd1k")
# remove low variance variables
x <- logd1k$x[, -c(17, 52, 59)]
y <- logd1k$y

# training set
x.tr <- x[1:300, ]
y.tr <- y[1:300]

# two test sets
x.te <- list(
  "test.1" = x[301:400, ],
  "test.2" = x[401:500, ]
)
y.te <- list(
  "test.1" = y[301:400],
  "test.2" = y[401:500]
)

set.seed(42)
ad <- enspls.ad(
  x.tr, y.tr, x.te, y.te,
  maxcomp = 3, alpha = c(0.3, 0.6, 0.9),
  space = "variable", method = "mc",
  ratio = 0.8, reptimes = 10
)
plot(ad)

# the interactive plot requires a HTML viewer
if (FALSE) { # \dontrun{
plot(ad, type = "interactive")
} # }
# the interactive plot requires a HTML viewer
if (FALSE) { # \dontrun{
plot(ad, type = "interactive")
} # }