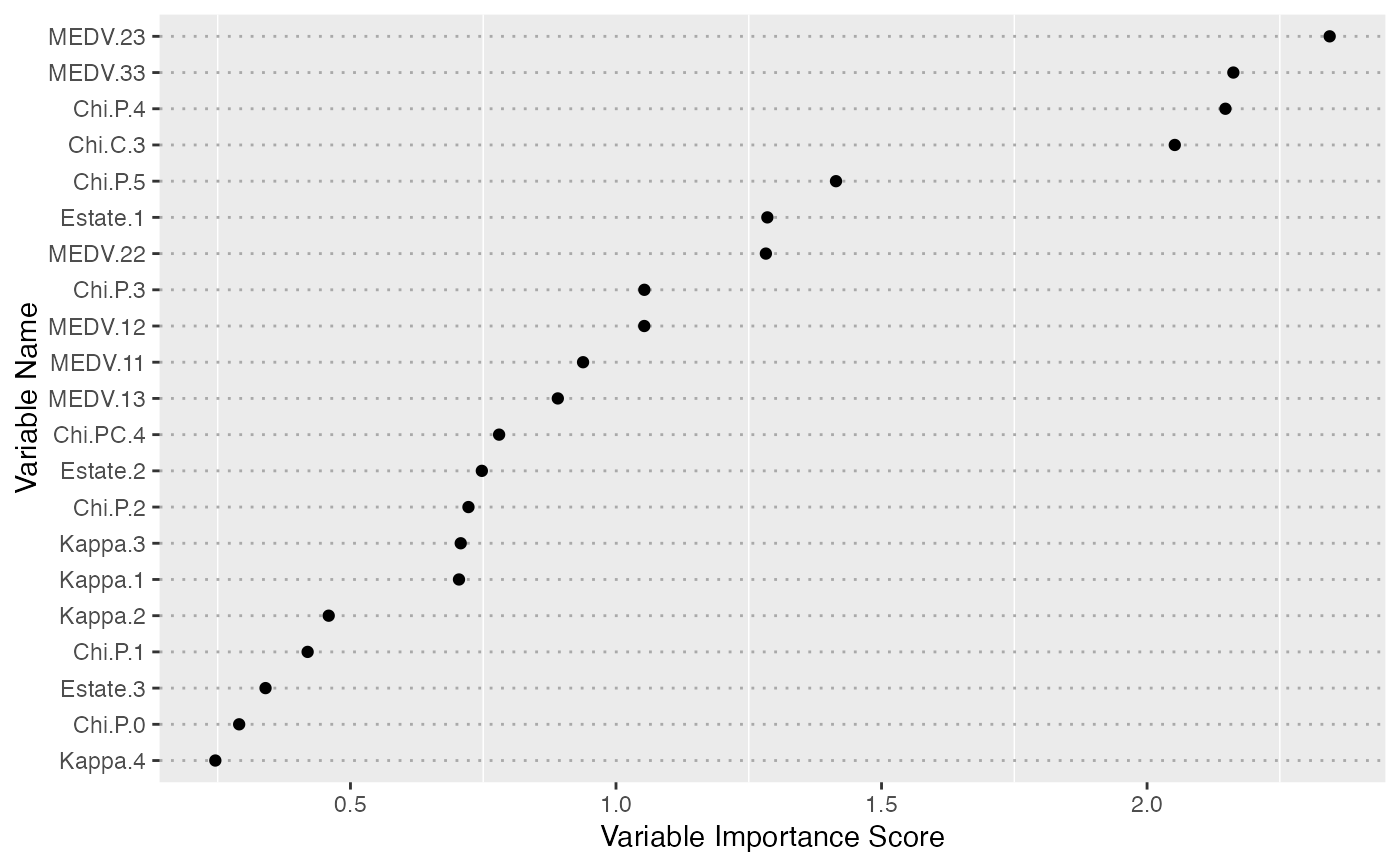
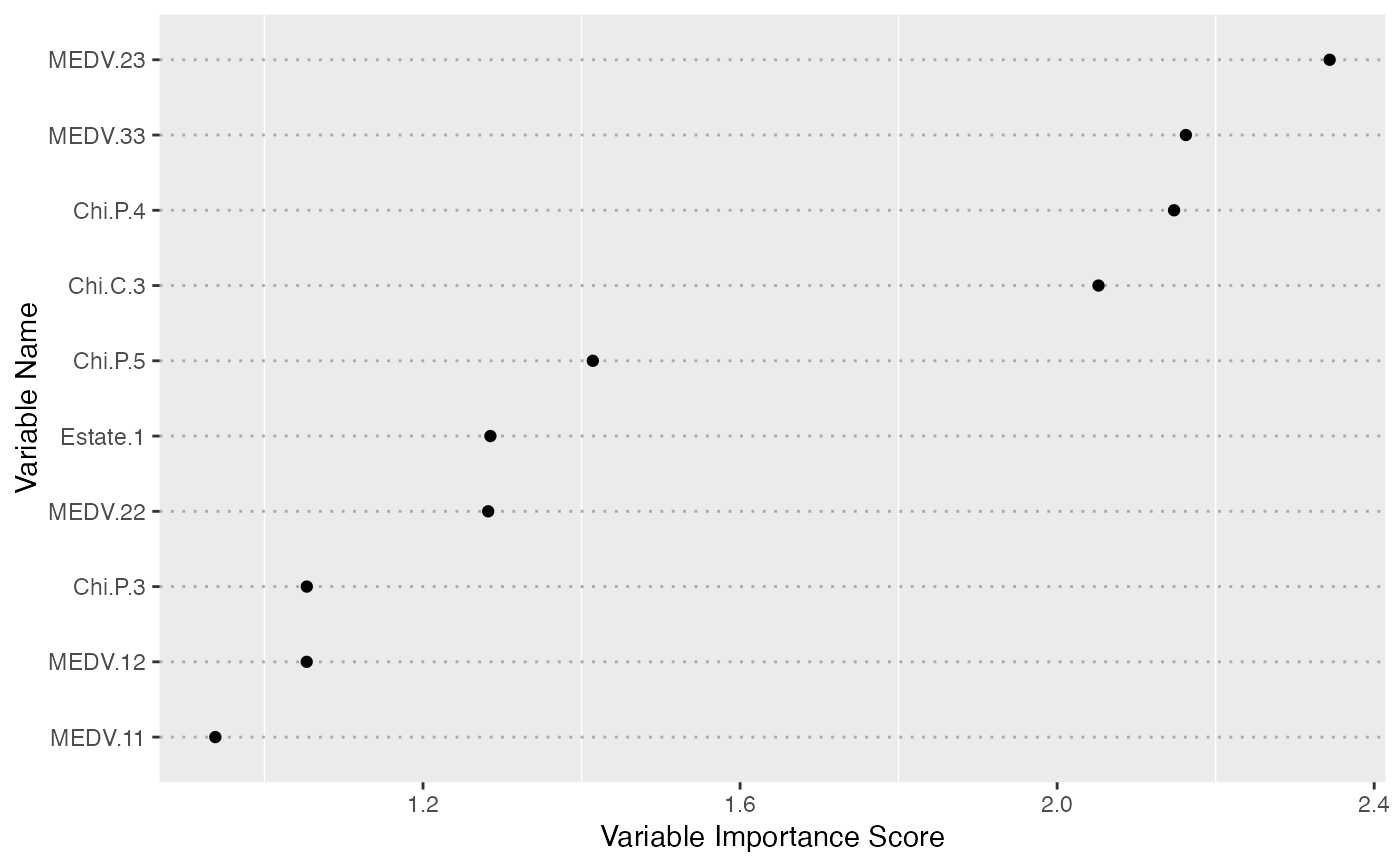
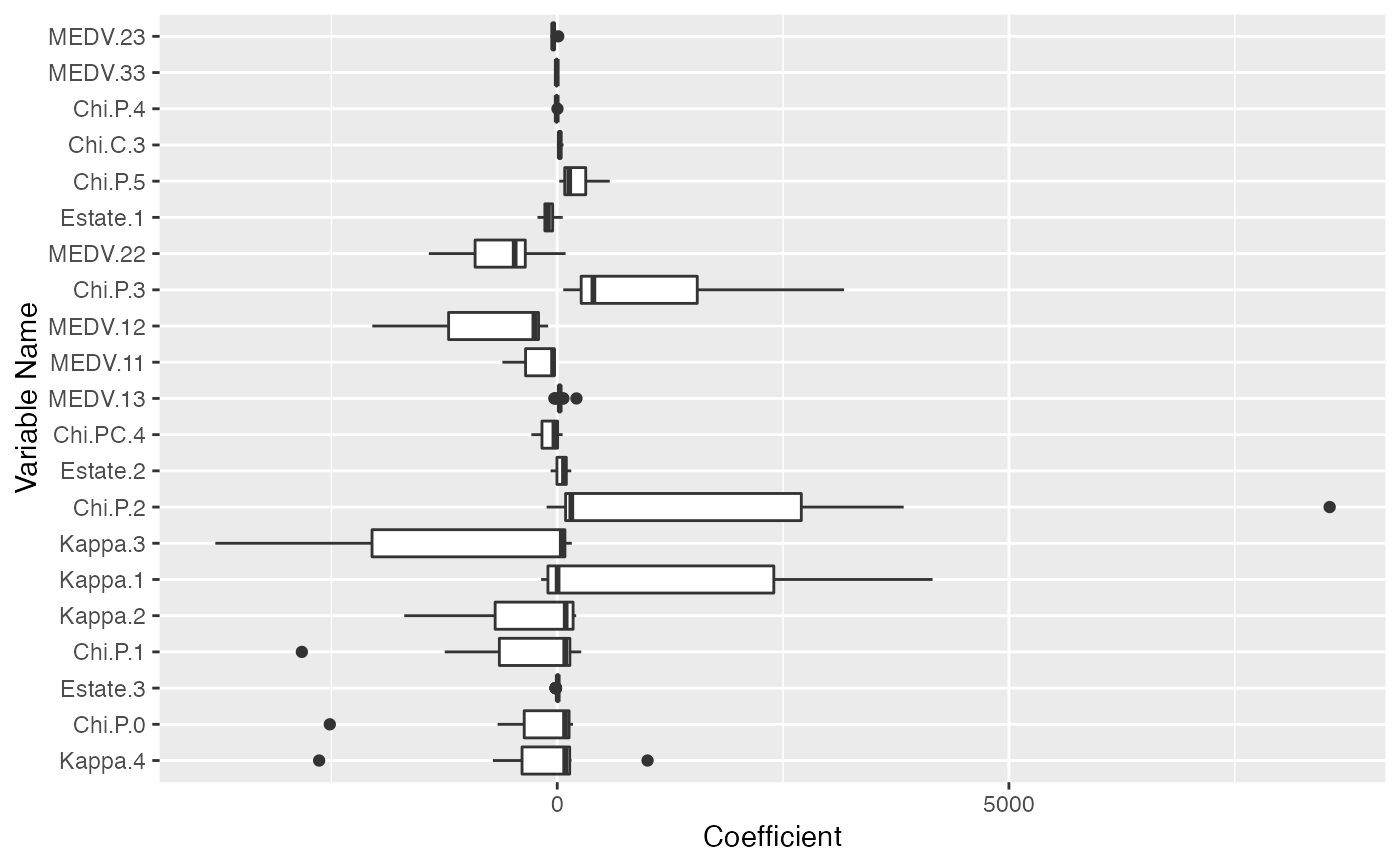
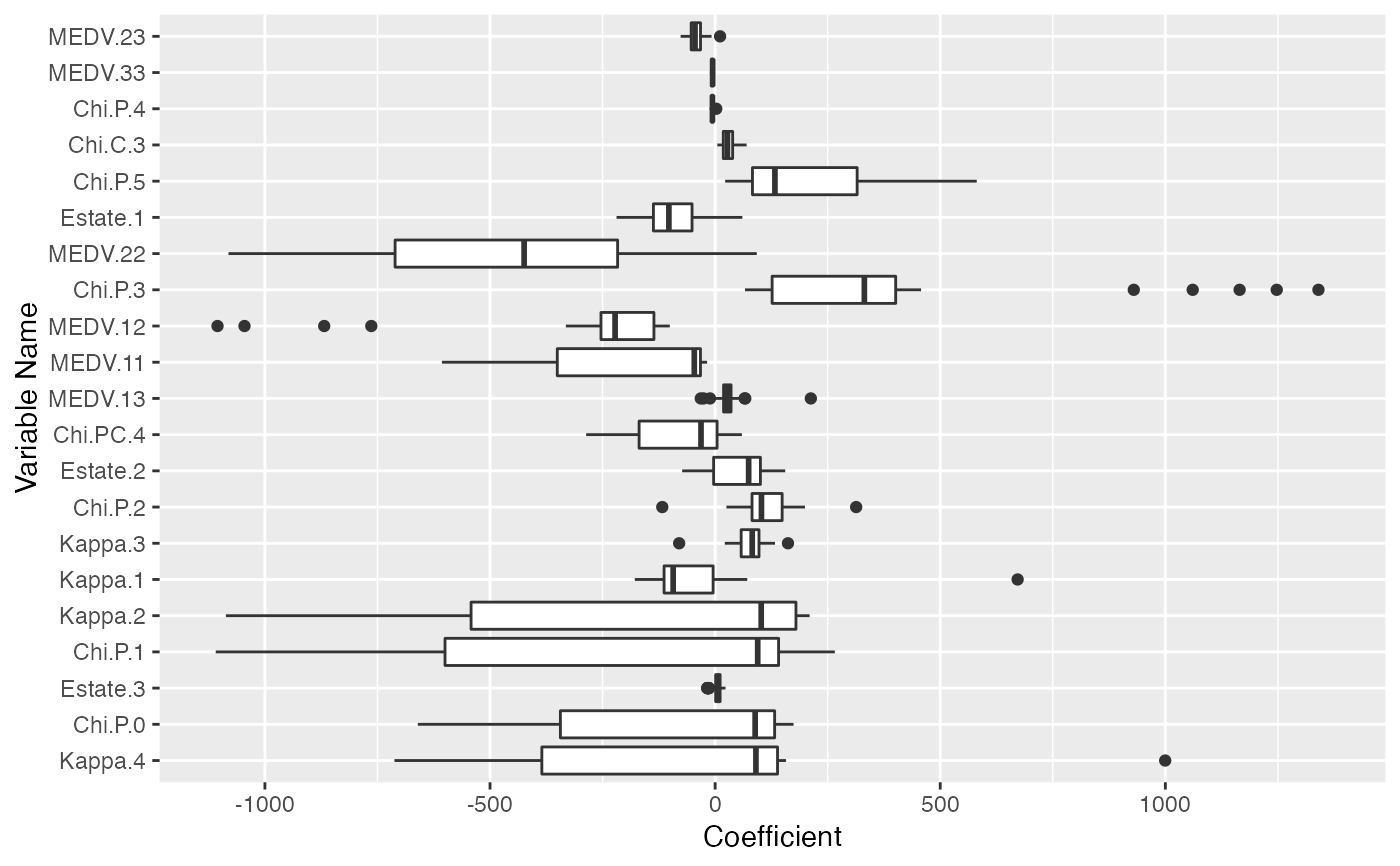
Plot enpls.fs object
Arguments
- x
An object of class
enpls.fs.- nvar
Number of top variables to show. Ignored if
sort = FALSE.- type
Plot type.
"dotplot"or"boxplot".- limits
Vector of length 2. Set boxplot limits (in quantile) to remove the extreme outlier coefficients.
- main
Plot title, not used currently.
- ...
Additional graphical parameters, not used currently.
See also
See enpls.fs for measuring feature importance with
ensemble partial least squares regressions.
Author
Nan Xiao <https://nanx.me>