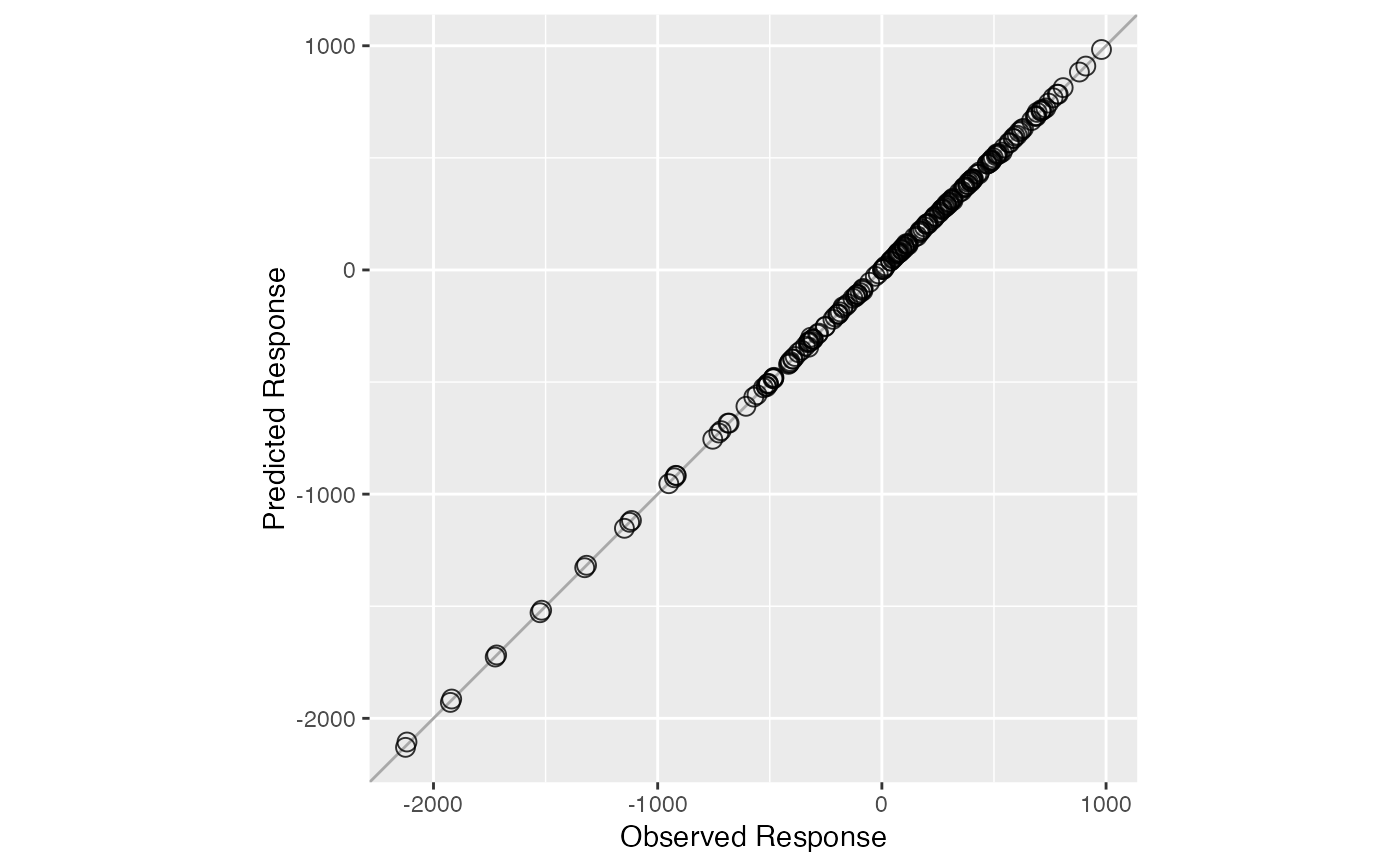
Plot cv.enpls object
Usage
# S3 method for class 'cv.enpls'
plot(x, xlim = NULL, ylim = NULL, alpha = 0.8, main = NULL, ...)
Arguments
- x
An object of class
cv.enpls.- xlim
x Vector of length 2 - x axis limits of the plot.
- ylim
y Vector of length 2 - y axis limits of the plot.
- alpha
An alpha transparency value for points, a real number in (0, 1].
- main
Plot title, not used currently.
- ...
Additional graphical parameters, not used currently.
See also
See cv.enpls for cross-validation of
ensemble partial least squares regression models.
Author
Nan Xiao <https://nanx.me>