Ensemble Sparse Partial Least Squares for Measuring Feature Importance
Source:R/enspls.fs.R
enspls.fs.RdMeasuring feature importance with ensemble sparse partial least squares.
Arguments
- x
Predictor matrix.
- y
Response vector.
- maxcomp
Maximum number of components included within each model. If not specified, will use
5by default.- cvfolds
Number of cross-validation folds used in each model for automatic parameter selection, default is
5.- alpha
Parameter (grid) controlling sparsity of the model. If not specified, default is
seq(0.2, 0.8, 0.2).- reptimes
Number of models to build with Monte-Carlo resampling or bootstrapping.
- method
Resampling method.
"mc"(Monte-Carlo resampling) or"boot"(bootstrapping). Default is"mc".- ratio
Sampling ratio used when
method = "mc".- parallel
Integer. Number of CPU cores to use. Default is
1(not parallelized).
Value
A list containing two components:
variable.importance- a vector of variable importancecoefficient.matrix- original coefficient matrix
See also
See enspls.od for outlier detection with
ensemble sparse partial least squares regressions.
See enspls.fit for fitting ensemble sparse
partial least squares regression models.
Author
Nan Xiao <https://nanx.me>
Examples
data("logd1k")
x <- logd1k$x
y <- logd1k$y
set.seed(42)
fs <- enspls.fs(x, y, reptimes = 5, maxcomp = 2)
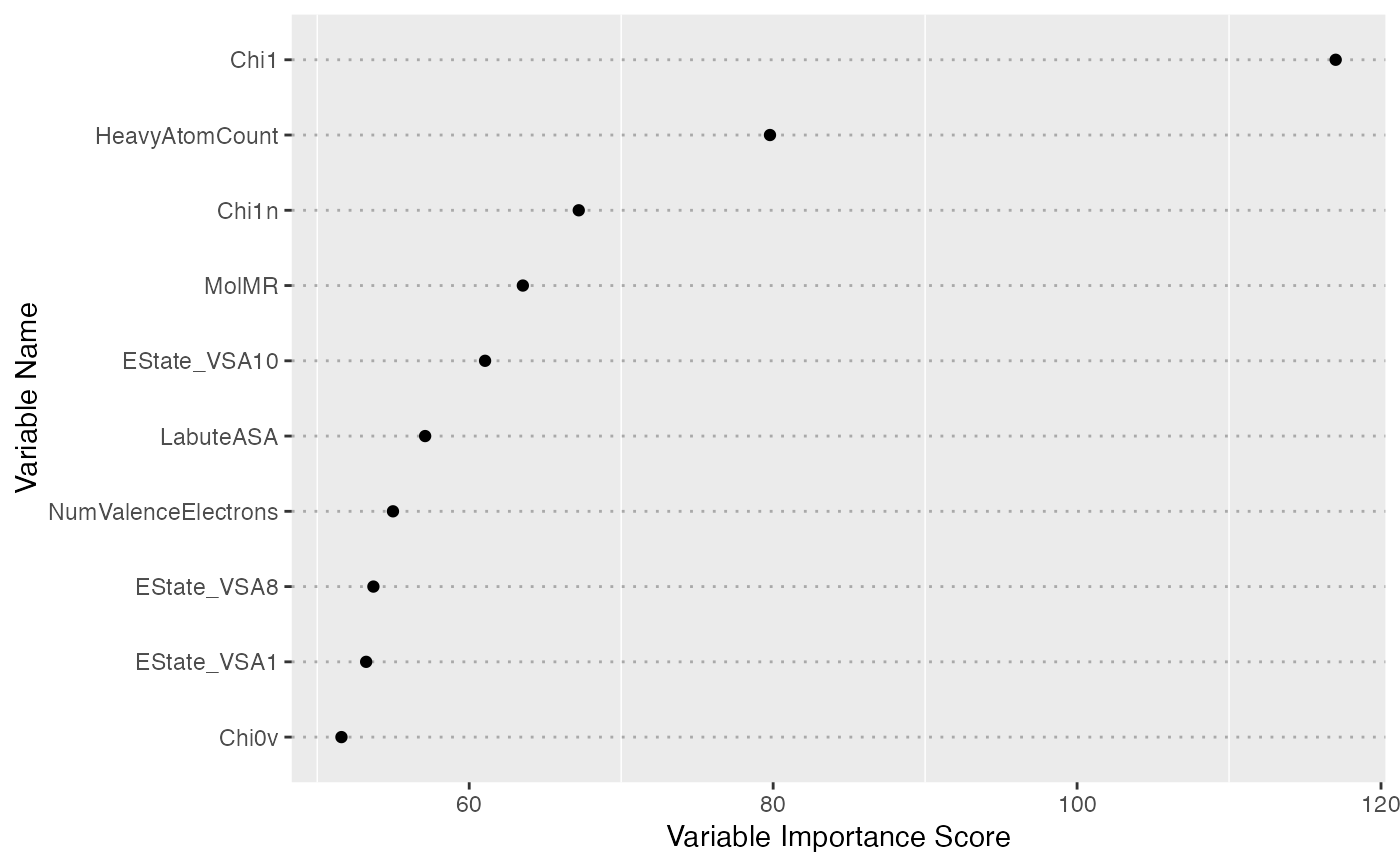
print(fs, nvar = 10)
#> Variable Importance by Ensemble Sparse Partial Least Squares
#> ---
#> Importance
#> Chi1 117.01631
#> HeavyAtomCount 79.79144
#> Chi1n 67.20777
#> MolMR 63.52919
#> EState_VSA10 61.04311
#> LabuteASA 57.09849
#> NumValenceElectrons 54.98234
#> EState_VSA8 53.69517
#> EState_VSA1 53.21826
#> Chi0v 51.59224
plot(fs, nvar = 10)
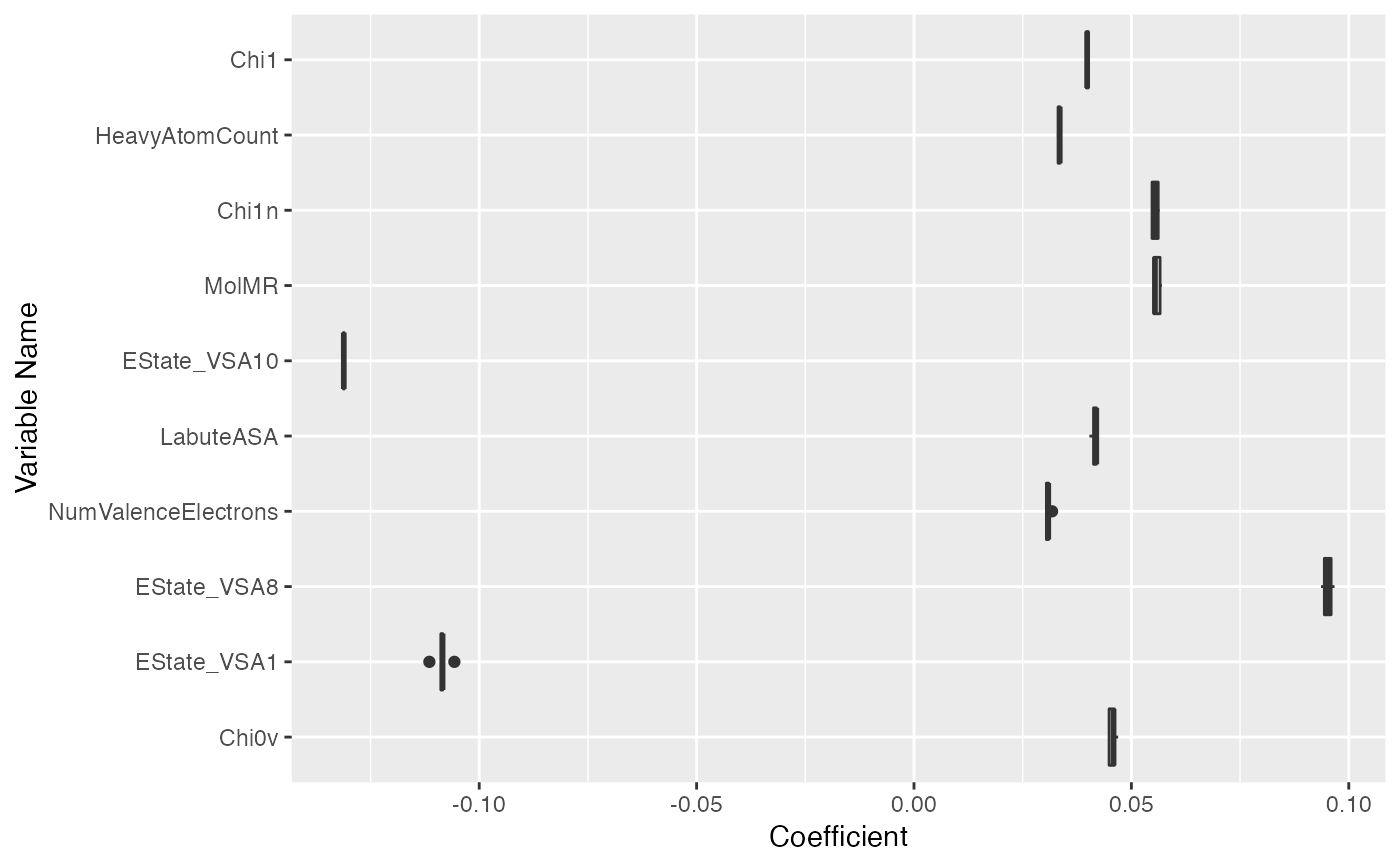
 plot(fs, type = "boxplot", limits = c(0.05, 0.95), nvar = 10)
#> Warning: Removed 6 rows containing non-finite outside the scale range
#> (`stat_boxplot()`).
plot(fs, type = "boxplot", limits = c(0.05, 0.95), nvar = 10)
#> Warning: Removed 6 rows containing non-finite outside the scale range
#> (`stat_boxplot()`).